英文互译镜像站

1796 United States presidential election in Massachusetts

Last updated

1796 United States presidential election in Massachusetts
Flag of Massachusetts.svg
  1792
November 4 – December 7, 1796
1800  
  Official Presidential portrait of John Adams (by John Trumbull, circa 1792) (farther 3x4 cropped) (cropped).jpg Thomas Pinckney (cropped 3x4).jpg NC-Congress-SamuelJohnston.JPG
Nominee John Adams Thomas Pinckney Samuel Johnston
Party Federalist Federalist Federalist
Home state Massachusetts South Carolina North Carolina
Electoral vote14132
Percentage100.00%

  OliverEllsworth.jpg
Nominee Oliver Ellsworth
Party Federalist
Home state Connecticut
Electoral vote1
Percentage

President before election

George Washington
Independent

Elected President

John Adams
Federalist

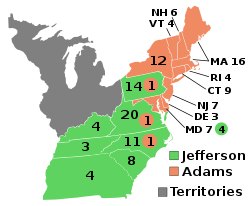
The 1796 United States presidential election in Massachusetts took place between November 4 and December 7, 1796, as part of the 1796 United States presidential election. There were 14 representatives, or electors to the Electoral College, two of them were appointed by Legislature, and the rest of them were chosen by state legislature from the two most popular candidates in each U.S. House district. And then, electors voted for President and Vice President. [1]

Contents

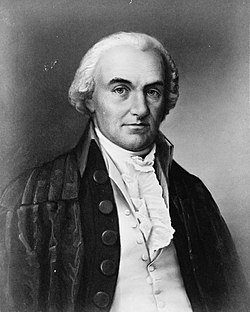
During this election, Massachusetts cast 14 electoral votes for incumbent Vice President and Massachusetts native John Adams. However, the detail of this election was not well protected, so the data is incomplete now. [2]

Results

1796 United States presidential election in Massachusetts [2]
PartyCandidateVotes%
Federalist John Adams 8,217 70.98%
Democratic-Republican Thomas Jefferson 3,35929.02%
Total votes11,576 100%

Results by county

1796 United States presidential election in Massachusetts [2]
CountyJohn Adams

Federalist

Thomas Jefferson

Democratic-Republican

MarginTotal

votes [a]

#%#%#%
Barnstable 37399.73%10.27%37299.46%374
Berkshire 44338.83%69861.17%-255-22.34%1,141
Bristol 24097.96%52.04%23595.92%245
Cumberland 22797.01%72.99%22094.02%234
Dukes 88100.00%00.00%88100.00%88
Essex 60091.32%578.68%54382.64%657
Hampshire 1,16190.92%1169.08%1,04581.84%1,277
Hancock 70100.00%00.00%70100.00%70
Lincoln 46491.34%448.66%42082.68%508
Middlesex 70252.90%62547.10%775.80%1,327
Nantucket 86100.00%00.00%86100.00%86
Norfolk 35356.75%26943.25%8413.50%622
Plymouth 39593.38%286.62%36786.76%423
Suffolk 1,48560.27%97939.73%50620.54%2,464
Washington -0.00%-0.00%-0.00%-
Worcester 1,15870.78%47829.22%68041.56%1,636
York 37287.74%5212.26%32075.48%424
Total8,21770.98%3,35929.02%4,85841.96%11,576

See also

Notes

  1. Results are taken from the highest voted federalist, and anti-federalist elector for each county. [2]

References

  1. "The Electoral Count for the Presidential Election of 1789". The Papers of George Washington. Archived from the original on September 14, 2013. Retrieved May 4, 2005.
  2. 1 2 3 4 "A New Nation Votes". elections.lib.tufts.edu. Retrieved February 1, 2026.


整站下载器 镜像站群霸屏 关键词转码站群 烟雨镜像程序 镜像软件