| Timeline of the 2014 Pacific hurricane season | |||||
|---|---|---|---|---|---|
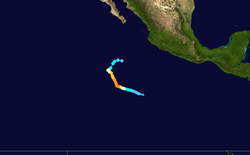
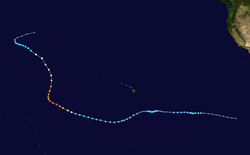
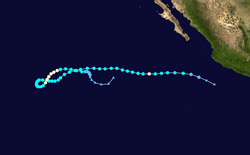
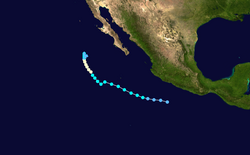
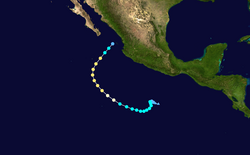
 Season summary map | |||||
| Season boundaries | |||||
| First system formed | May 22, 2014 | ||||
| Last system dissipated | November 5, 2014 | ||||
| Strongest system | |||||
| Name | Marie | ||||
| Maximum winds | 160 mph (260 km/h) (1-minute sustained) | ||||
| Lowest pressure | 918 mbar (hPa; 27.11 inHg) | ||||
| Longest lasting system | |||||
| Name | Karina | ||||
| Duration | 13.75 days | ||||
| |||||
The 2014 Pacific hurricane season consisted of the events that occurred in the annual cycle of tropical cyclone formation over the Pacific Ocean north of the equator and east of the International Date Line. The official bounds of each Pacific hurricane season are dates that conventionally delineate the period each year during which tropical cyclones tend to form in the basin according to the National Hurricane Center (NHC), beginning on May 15 in the Eastern Pacific proper (east of 140°W) and June 1 in the Central Pacific (140°W to the International Date Line), and ending on November 30 in both areas. However, tropical cyclogenesis is possible at any time of year. [1] The first tropical cyclone of the season, Hurricane Amanda, developed on May 22; the final, Hurricane Vance, dissipated on November 5.
Contents
On account of several unusually favorable atmospheric and oceanic factors, [2] the 2014 season was one of the most active on record for the basin. It produced twenty-three tropical depressions, of which all but one developed into named tropical storms; sixteen became hurricanes, of which nine further intensified into major hurricanes. [nb 1] [3]
This timeline documents tropical cyclone formations, strengthening, weakening, landfalls, extratropical transitions, and dissipations during the season. It includes information that was not released throughout the season, meaning that data from post-storm reviews by the National Hurricane Center and the Central Pacific Hurricane Center, such as a storm that was not initially warned upon, has been included.
The time stamp for each event is first stated using Coordinated Universal Time (UTC), the 24-hour clock where 00:00 = midnight UTC. [4] The NHC uses both UTC and the time zone where the center of the tropical cyclone is currently located. Prior to 2015, two time zones were utilized in the Eastern Pacific basin: Pacific east of 140°W, and Hawaii−Aleutian from 140°W to the International Date Line. [5] [6] In this timeline, the respective area time is included in parentheses. Additionally, figures for maximum sustained winds and position estimates are rounded to the nearest 5 units (miles, or kilometers), following National Hurricane Center practice. Direct wind observations are rounded to the nearest whole number. Atmospheric pressures are listed to the nearest millibar and nearest hundredth of an inch of mercury.