| Timeline of the 2005 Atlantic hurricane season | |
|---|---|
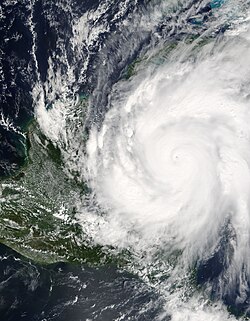
 Season summary map | |
| Season boundaries | |
| First system formed | June 8, 2005 |
| Last system dissipated | January 6, 2006 |
| Strongest system | |
| Name | Wilma |
| Maximum winds | 185 mph (295 km/h) (1-minute sustained) |
| Lowest pressure | 882 mbar (hPa; 26.05 inHg) |
| Longest lasting system | |
| Name | Irene |
| Duration | 14 days |
The 2005 Atlantic hurricane season was an event in the annual tropical cyclone season in the north Atlantic Ocean. It was the second most active Atlantic hurricane season in recorded history, and the most extreme (i.e. produced the highest accumulated cyclone energy (ACE)) in the satellite era. [1] Officially, the season began on June 1, 2005 and ended on November 30, 2005. These dates, adopted by convention, historically delimit the period in each year when most tropical systems form. [2] The season's first storm, Tropical Storm Arlene, developed on June 8. The final storm, Tropical Storm Zeta, formed in late December and persisted until January 6, 2006. Zeta is only the second December Atlantic storm in recorded history to survive into January, joining Hurricane Alice in 1955. [3]
Contents
- Timeline
- June
- July
- August
- September
- October
- November
- December
- January 2006
- See also
- Notes
- References
- External links
The season's impact was widespread and catastrophic. Its storms touched virtually every part of the Atlantic basin. [1] Altogether, there were 28 named tropical storms during the season, exhausting the annual pre-designated list and resulting in the usage of six Greek letter names. A record 15 tropical storms attained hurricane strength, of which a record seven intensified into major hurricanes. [nb 1] Six hurricanes made landfall or near-landfall on the U.S. during the season: Cindy, Dennis, Katrina, Ophelia, Rita and Wilma. [1]
This timeline documents tropical cyclone formations, strengthening, weakening, landfalls, extratropical transitions, and dissipations during the season. It includes information that was not released throughout the season, meaning that data from post-storm reviews by the National Hurricane Center, such as a storm that was not initially warned upon, has been included.
The time stamp for each event is first stated using Coordinated Universal Time (UTC), the 24-hour clock where 00:00 = midnight UTC. [5] The NHC uses both UTC and the time zone where the center of the tropical cyclone is currently located. The time zones utilized (east to west) prior to 2020 were: Atlantic, Eastern, and Central. [6] In this timeline, the respective area time is included in parentheses. Additionally, figures for maximum sustained winds and position estimates are rounded to the nearest 5 units (miles, or kilometers), following National Hurricane Center practice. Direct wind observations are rounded to the nearest whole number. Atmospheric pressures are listed to the nearest millibar and nearest hundredth of an inch of mercury.