| Timeline of the 1972 Atlantic hurricane season | |||||
|---|---|---|---|---|---|
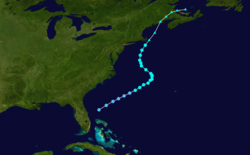
 Season summary map | |||||
| Season boundaries | |||||
| First system formed | May 23, 1972 | ||||
| Last system dissipated | November 7, 1972 | ||||
| Strongest system | |||||
| Name | Betty (Bravo) | ||||
| Maximum winds | 105 mph (165 km/h) (1-minute sustained) | ||||
| Lowest pressure | 976 mbar (hPa; 28.82 inHg) | ||||
| Longest lasting system | |||||
| Name | Betty (Bravo) | ||||
| Duration | 10 days | ||||
| |||||
The 1972 Atlantic hurricane season was a cycle of the annual tropical cyclone season in the Atlantic Ocean in the Northern Hemisphere. It was a significantly below average season, [nb 1] having only four fully tropical named storms, the fewest since 1930. [2] It was one of only five Atlantic hurricane seasons since 1944 to have no major hurricanes, [nb 2] the others being 1968, 1986, 1994, and 2013. The season officially began on June 1, 1972 and ended on November 30, 1972. These dates, adopted by convention, historically describe the period in each year when most tropical systems form. [4] However, storm formation is possible at any time of the year, as demonstrated in 1972 by the formation of Subtropical Storm Alpha on May 23. The season's final storm, Subtropical Storm Delta, dissipated on November 7.
Contents
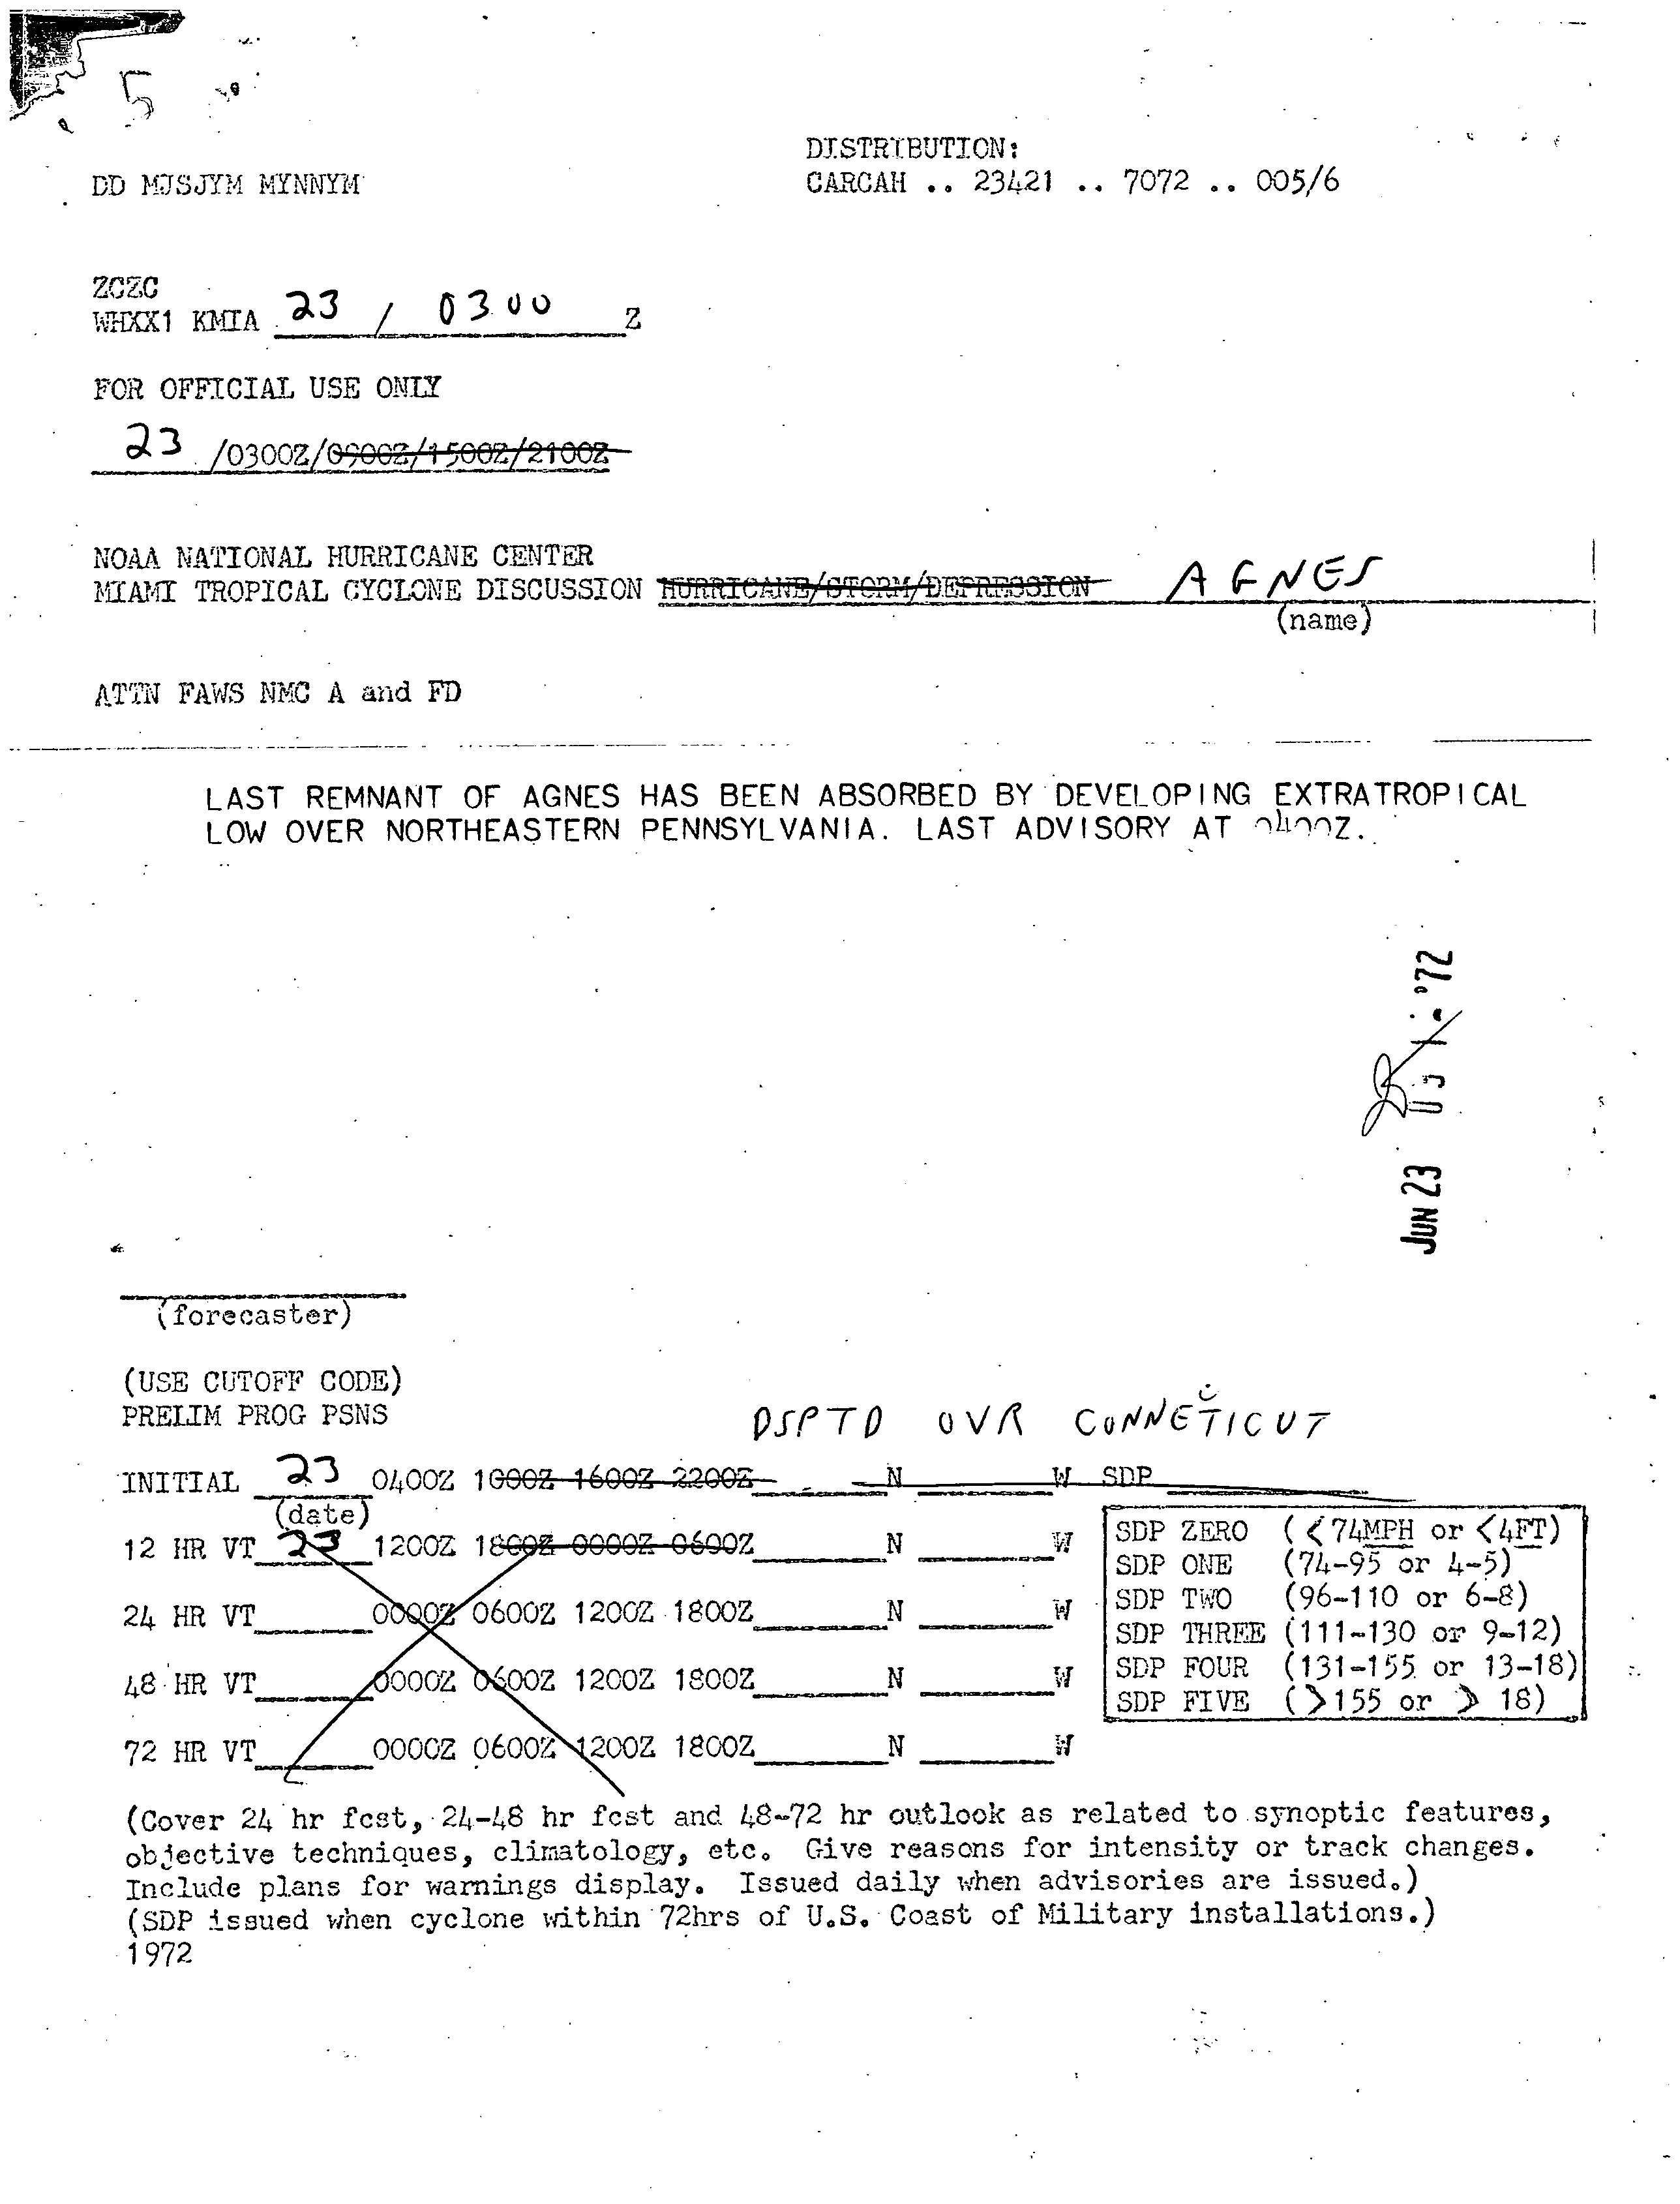
The season produced nineteen tropical or subtropical cyclones, of which seven intensified into tropical or subtropical storms; three became hurricanes, of which only but only one, Betty, had sustained winds greater than minimum hurricane force. Despite its relative inactivity, the 1972 season resulted in one of the worst natural disasters in American history, Hurricane Agnes. Agnes was a weak but large storm that initially made landfall on the Florida Panhandle before moving up the eastern United States. The hurricane killed 122 people and caused $2.1 billion (1972 USD) in damage, mostly due to flooding in Pennsylvania and New York. [2]
This timeline documents tropical cyclone formations, strengthening, weakening, landfalls, extratropical transitions, and dissipations during the season. It includes information that was not released throughout the season, meaning that data from post-storm reviews by the National Hurricane Center, such as a storm that was not initially warned upon, has been included.
The time stamp for each event is first stated using Coordinated Universal Time (UTC), the 24-hour clock where 00:00 = midnight UTC. [5] The NHC uses both UTC and the time zone where the center of the tropical cyclone is currently located. The time zones utilized (east to west) prior to 2020 were: Atlantic, Eastern, and Central. [6] In this timeline, the respective area time is included in parentheses. Additionally, figures for maximum sustained winds and position estimates are rounded to the nearest 5 units (miles, or kilometers), following National Hurricane Center practice. Direct wind observations are rounded to the nearest whole number. Atmospheric pressures are listed to the nearest millibar and nearest hundredth of an inch of mercury.


