英文互译镜像站

Poland (European Parliament constituency)

Last updated

The Poland constituency within the European Union. EU location POL.png
The Poland constituency within the European Union.
Map of European Parliament constituencies in Poland. European Parliament constituencies Poland.png
Map of European Parliament constituencies in Poland.

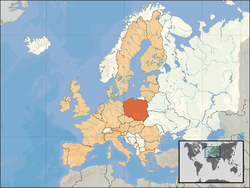
In European elections, the member state of Poland is subdivided into constituencies. However, the number of seats in each subconstituency is not decided until after the election. Poland therefore is sometimes treated as a single constituency for purposes of reportage.

Contents

List of constituencies

ConstituencyArea/CommunitySeatsPopulation, 2012 [1] (thousands)Area [2] (km2)
At elec­tionCur­rentTotalPer cur. seat
Pomeranian Pomeranian Voivodeship 332,28776218,310
Kuyavian-Pomeranian Kuyavian-Pomeranian Voivodeship 222,0971,04917,972
Podlaskie and Warmian-Masurian Podlaskie and Warmian-Masurian Voivodeships 332,65188444,360
Warsaw Part of the Masovian Voivodeship: City of Warsaw and Sejm Constituency no. 20 [note 1] 662,79546611,205
Masovian The rest of the Masovian Voivodeship [note 2] 332,49983324,353
Łódź Łódź Voivodeship 332,52984318,219
Greater Poland Greater Poland Voivodeship 553,35067015,183
Lublin Lublin Voivodeship 332,16973225,122
Subcarpathian Subcarpathian Voivodeship 332,12971017,846
Lesser Poland and Świętokrzyskie Lesser Poland and Świętokrzyskie Voivodeships 564,73578941,537
Silesian Silesian Voivodeship 774,62166012,333
Lower Silesian and Opole Lower Silesian and Opole Voivodeships 443,92898229,359
Lubusz and West Pomeranian Lubusz and West Pomeranian Voivodeships 442,74568636,880

2004

The 2004 European election was the sixth election to the European Parliament. However, as Poland had only joined the European Union earlier that month, it was the first election European election held in that state. The election took place on 13 June.

The elections resulted in a heavy defeat for the governing Alliance of the Democratic Left and Labor Union parties, although the very low turnout makes a direct comparison with national election results difficult. As expected the most successful party was the Civic Platform. Second place was taken by the strongly anti-EU League of Polish Families.

The radical populist Self-Defense of the Polish Republic, which some opinion polls had predicted would come second, came fourth after the Law and Justice party. The election results were a success for Social Democracy of Poland, which managed to cross the required 5% threshold, and the Freedom Union, which got over twice the expected percentage of votes.

2009

The 2009 European Parliament election in Poland was on Sunday 7 June 2009 and the number of seats was 50. [3]

References

  1. Eurostat (14 March 2014). "Average annual population (1000) by NUTS 2 region" . Retrieved 26 May 2014.
  2. Eurostat (19 May 2014). "Total area and land area by NUTS 2 region" . Retrieved 26 May 2014.
  3. "Wyjasnienia Państwowej Komisji Wyborczej z dnia 10 marca 2009 r. o zasadach gospodarki finansowej, uzyskiwaniu przychodów oraz o wydatkach związanych z finansowaniem kampanii wyborczej w wyborach do Parlamentu Europejskiego, zarządzonych na dzień 7 czerwca 2009 r."/"Notice from the State Electoral Commission of 10 March 2009 by decree of the President of the Republic of Poland to the election of the members of the European Parliament and of the constituencies and the premises of district election commission" Archived 16 July 2011 at the Wayback Machine , pkw.gov.pl, 10 March 2009, English translation here, pdf copy here Archived 19 March 2009 at the Wayback Machine
网站克隆 泛镜像站群 干扰字符镜像 开源整站镜像工具 主动推送镜像站群